Data Distributions
August 4, 2025
Getting Started
We need to set up a virtual environment and download essential packages we'll be using throughout this series. I'll be using VS Code in the videos but feel free to choose an code editor or IDE of your choosing.
Creating a virtual environment
Installing Jupyter Notebooks in VS Code
Downloading Essential Packages
Three packages that I recommend you download now are numpy, pandas, and matplotlib. These are important and we'll be using them throughout the series. We'll add more packages as required. It is recommended you create a virtual environment for following along this series and install the packages in the venv.
pip install numpy pandas matplotlib
Understanding data: Distributions, Probability Density Functions, and Histograms
Summary Statistics
Suppose we have a dataset consisting of 3 variables. One of the first ways we get an intuition for the data is by checking the summary statistics. For example, we check the mean, median, mode, standard deviation, and range of the variables. By doing this we get a sense of the
We start the series by talking about data. We want to make sense of data and to do that we want to understand the structure and spread of data. One of the simplest but powerful ways of doing this is by plotting a histogram for a variable. By doing this, we are able to get insight into the distribution of that variable.
Consider a dataset containing heights and weights for 25,000 humans aged 18 years. You can download this dataset for free here. I opened the .csv file in Excel and plotted a histogram of heights.
[ Insert chart here ]
We observe a bell shape being formed by the bins.
Characteristics of data
Data can be spread in countless ways but there are some commonly observable patterns and characteristics. I discuss some basic characteristics below.
Skewness: Skewness is the __. You can read more about skewness here.
Number of modes:
- Unimodal: Unimodal distribution is one in which the observations for the given variable have one observable mode.
- Bimodal:
- Trimodal:
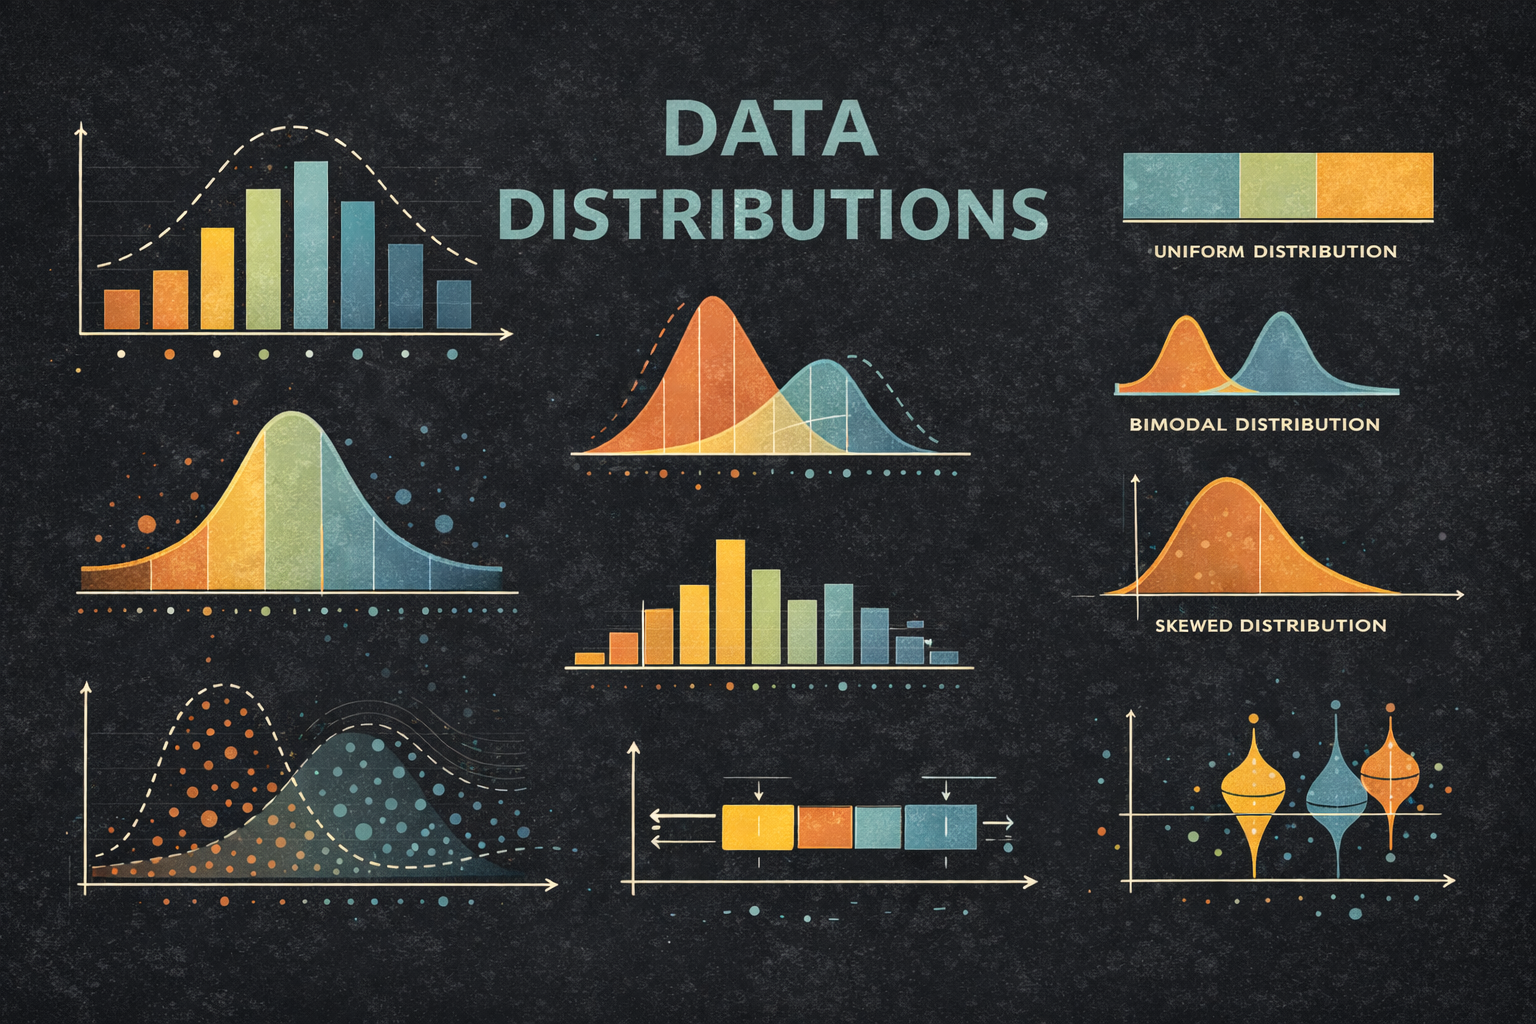
Common types of distributions:
- Normal Distribution: Also known as gaussian distribution, we
- Uniform Distribution is one where the observations for a variable are uniformally distributed within a given range.
Conclusion
Understanding the distribution of data is the first tool in our toolkit. It's important to get an intuitive sense of data before we even start to model it.